If You or Your Organization is Using or is Planning on Using Intrinsic Potential (IP) Modeling, Keep Reading
Habitat intrinsic potential modeling, commonly abreviated as "IP", often uses a watershed attribute referred to as "channel confinement (e.g., valley width divided by channel width)"; this is true of the IP models for coho salmon and steelhead trout (Burnett et al. 2007) used in the Pacific Northwest and beyond.
When the intrinsic habitat modeling approach was first applied to salmon in the early 2000s (Burnett et al. 2003, Burnett et al. 2007), the algorithm that was used to map channel confinement was based on calculating valley width at an elevation above the channel equivalent to five times bankfull depth (Burnett, Miller 2002). This approach was incorporated into many regional mapping efforts by state and federal agencies, NGOs and universities. It has also been incorporated into NetMap's tool kit. All NetMap's IP models that require channel confinement (coho and steelhead at a minimum) have used this approach for over a decade.
But more than a decade later, digital mapping technology has improved along with increasing availability of higher resolution DEMs. Recently, NetMap has incorporated advances in modeling/mapping channel confinement, specifically the width of floodplains, and this, in combination with increasing availability of high resolution digital elevation models such as LiDAR, is leading to more accurate predictions of fish habitat quality, those that use the occurrence and size of floodplains.
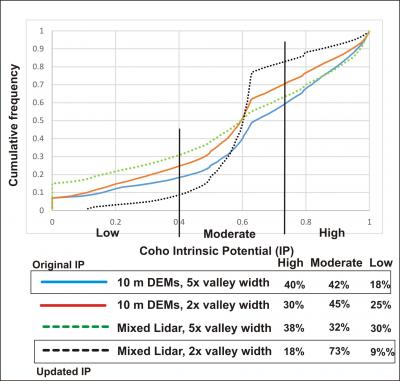 Thus, your existing maps of intrinsic potential, specifically for coho salmon and steelhead trout, may be out of date and may need to be rebuilt. Inaccuracies can include an overestimate in the amount of areas with the highest IP scores (>0.75), an underestimate in areas with moderate IP scores (0.4 - 0.75) and larger proportions of areas with low IP scores (see Figure to the right showing cumulative frequency data for a watershed in NE Oregon encompassing 12,000 salmon reaches).
However, what is needed is an update to the IP modeling parameters and to evaluate the field data on valley confinement (floodplain width) with respect to the newest floodplain mapping technology. TerrainWorks is seeking collaborative relationships to update the IP models. Contact Us.
If you would like to rebuild and update your intrinsic habitat potential maps and have access to NetMap datasets based on 10 m DEMs, go here.
If you would like to rebuild and update your intrinsic habitat potential maps and have access to LiDAR or a mixture of LiDAR and 10 m DEMs (or DEMs of other resolutions), go here.
If you are building your own customized IP habitat maps that use attributes of floodplain width or channel confinement, make sure you are using the latest NetMap mapping technology.
To learn more about this issue, see below:
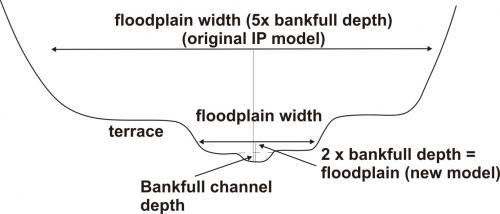 During the early development of intrinsic potential modeling, valley confinement was calculated by mapping the valley width at five times bankfull depth (valley width or floodplain width is commonly identified by an elevation equivalent to a multiple of bankfull depths, so as to normalize valley or floodplain width by channel size). This was because mapping technologies were insufficient to resolve small changes in valley floor elevation, including related to the relatively low resolution DEMs available at that time (30 - 10m). See Figure.
New mapping technologies in NetMap can now be used to better resolve the actual floodplain; thus in IP models, valley confinement is equivalent to floodplain width divided by channel width.
See the difference between 5x bankfull depth and 2x bankfull depth valley floors using 10 m and LiDAR DEMs
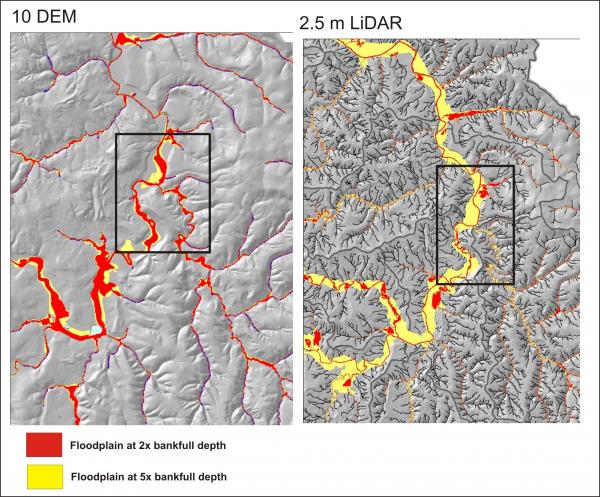 See the Figure to the right to visually compare, using 10 m and LiDAR DEMs, the difference between the spatial extent of the valley width at 5x bankfull depth and at 2x bankfull depth (the 2x valley surface is mapped using the latest technology available in NetMap). In the 10 m DEM, in most areas the 5x bankfull depth surface is wider than the 2x surface. This would result in less confined channels and in the IP model an over estimate of coho IP scores. See Figure to the right showing an area in the Nehalem watershed located in Northwestern Oregon. The potential inaccuracies in predicted IP values using the 5x bankfull depth valley floor to calculate channel confinement using 10 m and LiDAR DEMs are shown in the top figure on this page.
Use of older technologies can lead to a 100% overestimate in the highest IP scores (>0.75), a significant underestimate in moderate IP scores (0.4 - 0.75) and a larger proportions of low IP scores than actually exist.
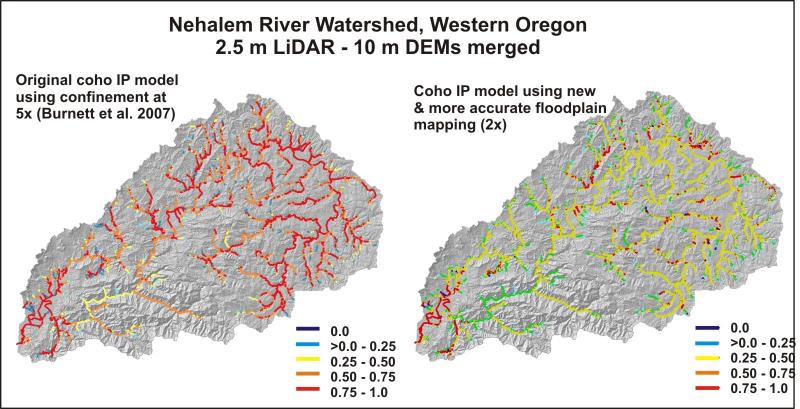
Using a mixed LiDAR-10 m DEM, the differences in predicted coho IP values are shown for the Nehalem watershed in Northeastern Oregon.
The largest potential differences occur between the 10 m DEM 5x bankfull depth channel confinement calculation and the LiDAR 2x bankfull channel depth calculation (Figure immediately above, and also see top most Figure on this page).
Thus, for a greater potential accuracy in predicting fish habitat intrinsic potential, use LiDAR or mixed LiDAR-10 m DEMs with the newest floodplain mapping technology in NetMap using 2x bankfull depth as the floodplain elevation.
Other Important Uses!
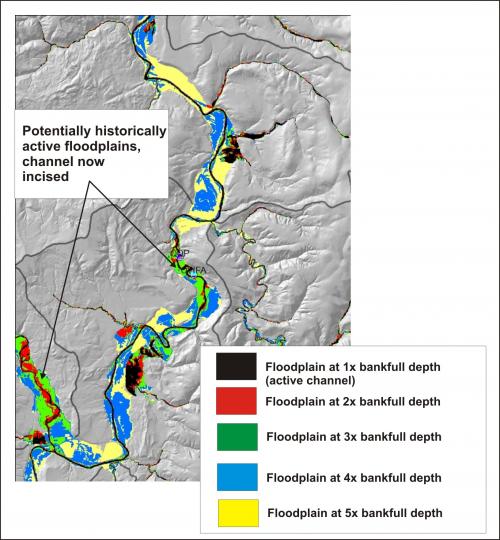 In addition to greatly improving the accuracy of your fish habitat IP maps, the use of NetMap's newest floodplain mapping technology with LiDAR DEMs can be used to identify historical floodplains that have since been diked and abandoned. Identifying historically active floodplains could be used to inform floodplain and fish habitat restoration activities.
See an example from Spain here.
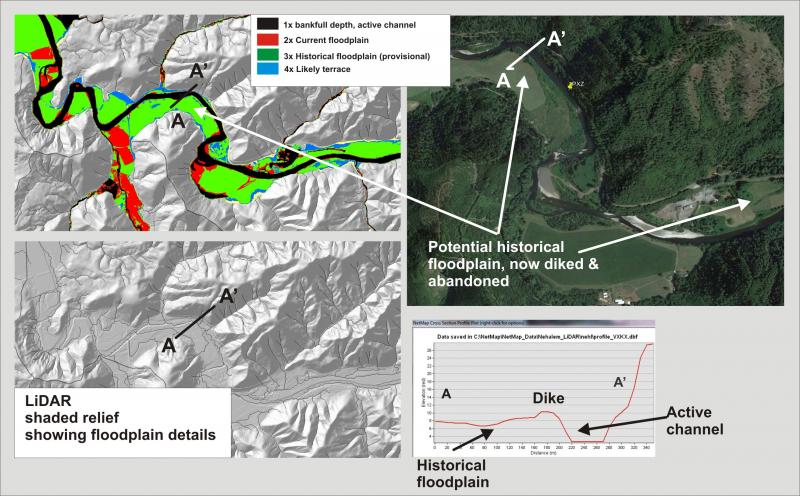 Use of NetMap's advanced floodplain mapping tool to identify the effects of diking on limiting the extent of floodplains.
