 Map Your Spatially Varying Fish Habitats
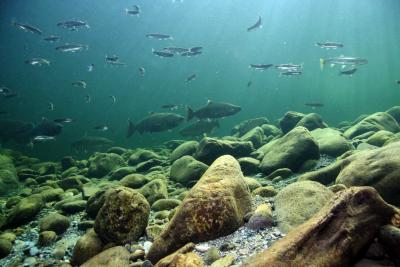
Not all streams and rivers are created equally with respect to fish habitat. Lower gradient and unconstrained stream reaches are more suitable to coho salmon (Oncorhynchus Kisutch), compared to steeper and more confined reaches that are better suited to steelhead trout (O. mykiss) and west slope cutthroat trout (O.clarkii lewisi). Although agencies, NGOs and others have maps of fish distribution, computer tools are used to obtain an assessment of variable habitat quality and also distribution, particularly in watersheds there little data are available.
TerrainWorks contains several published models of fish habitat and it also contains generic modeling structure to provide analysts the capabilities to alter existing models or to create new ones.
Published fish models include:
- Coho salmon (Burnett et al. 2007)
- Steelhead (“ “)
- Chinook (“ “)
- Westslope cutthroat trout (Peterson et al. 2008)
- Bull trout (Rich et al. 2003)
- Define Fish Bearing streams
- Biological hotspots
- Habitat diversity
- Beaver Habitat
- Floodplain extent
- Channel disturbance
- Piscicide
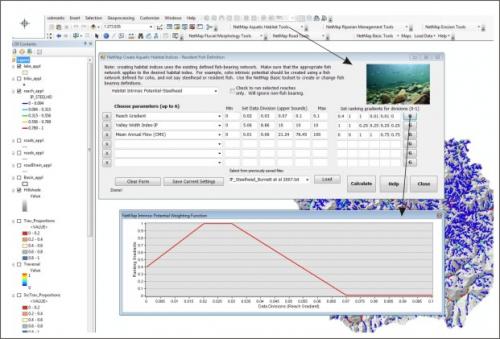
 Once a fish bearing network is defined in TerrainWorks or a fish layer has been imported into the tool kit, models are used to define the varying quality of fish habitat. Use published models (or modify them) or create your own and apply them.
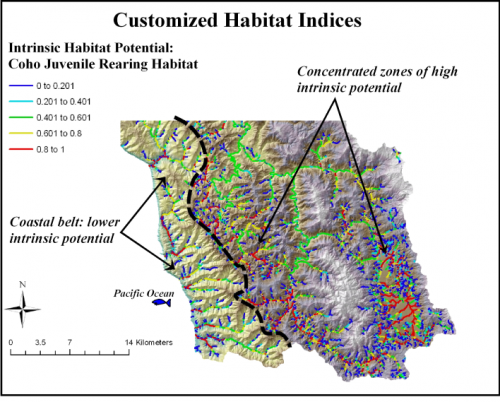
Predict Biological Hotspots
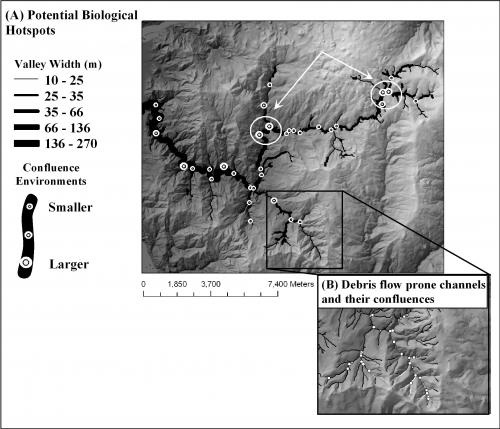 Use TerrainWorks (NetMap) tools to predict biological hotspots for fish and other aquatic life. Combine attributes of channel gradient, floodplains, variation in valley morphology (constrained/unconstrained), and tributary confluence effects to build your own custom model of watershed wide biological hotspots.
Predict Stressor - Habitat Intersections
The advantage of computer mapping of fish habitats within TerrainWorks is that they can be evaluated in context with environmental stressors including roads, timber harvest, energy development, urbanization, erosion, thermal loading, roads and climate change.
![]()
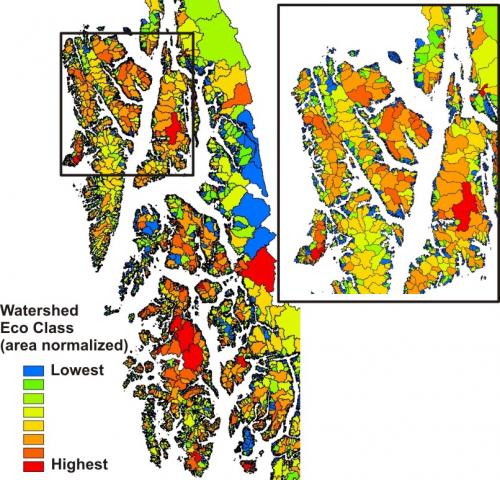
Create Watershed Habitat Classification
The Sort & Rank tool allows fish habitat quality, among other things (including roads, erosion potential, fire risk, vegetation age etc.), to be classified at the scale of subbasins. Although TerrainWorks datasets come loaded with HUC 6 (12 digit) subbasins, a user may import their own subbasin polygons. TerrainWorks calculated the frequency distribution of any parameter at the scale of individual HUC 6 basins on the fly and then allows the analyst to select from the distribution (mean, median, some percentile of the distribution) and thus classify by that distribution value.
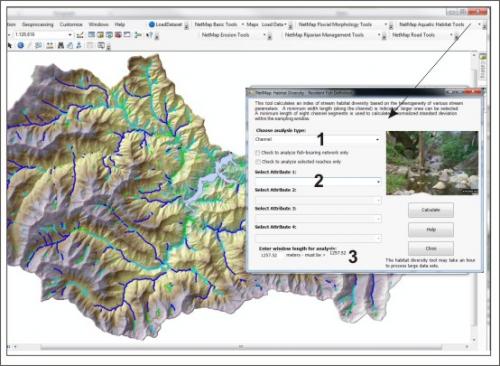
Map Habitat Diversity
Use NetMap's tools to map habitat diversity. Identify channel segments where a range of physical parameters vary over relatively short distances. Variables can include channel gradient, width, depth, substrate, floodplain width and tributary confluences.
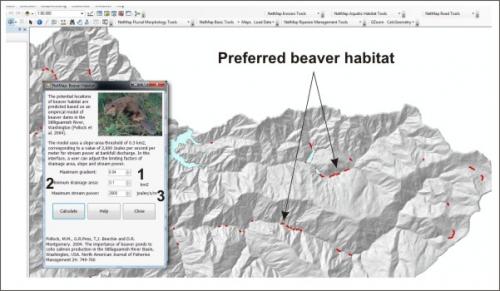
Map Beaver Habitat
Map channel disturbance potential: where would channel restoration projects be most at risk from dynamic watershed conditions.
Create Unique Ecological Classification Schemes
As part of the Tongass-NetMap in southeast Alaska, an analysis of estuary habitats was done in conjunction with Colorado State University (Fuller et al. 2012). The estuary analysis, in combination with watershed characteristics (fish habitats, floodplains, and river network geometry-confluence effects), was used to create a provisional watershed ecological classification scheme. SeeNetMap’s Forestry Applications.