The Marys River Watershed Council (Corvallis, Oregon) funded a LiDAR (1 m) based NetMap virtual watershed with tools to support watershed restoration activities and to provide input to other resource management and conservation actions. The watershed (area 320 mi2, 785 km2, 204,000 acres) includes forested, urban and agricultural areas. This is a good example how an advanced digital analysis system in a large watershed can be built for $15,000.
Examples of some of the analyses follow.
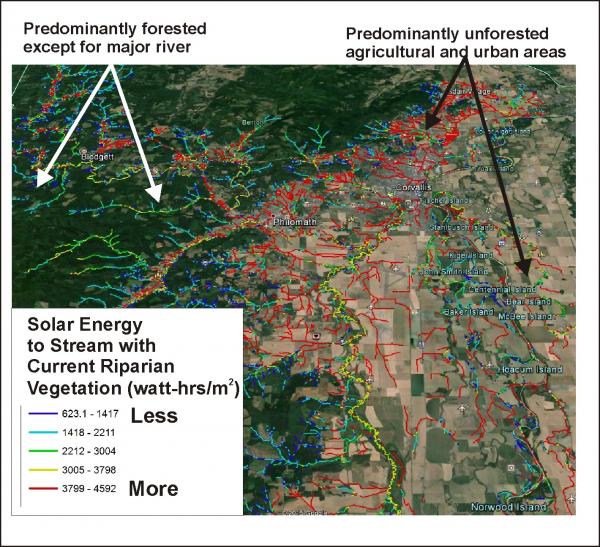
 Where is the lowest stream shading and the greatest potential for warmer stream temperatures?
Using LEMMA data on riparian vegetation, NetMap's analysis indicate where the lowest shade and the
highest thermal loading potential exists in the watershed.
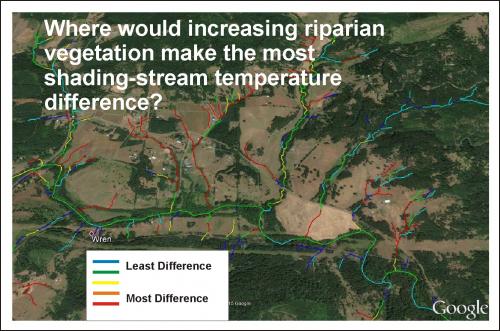
 One can estimate where, in the watershed, increases in
riparian vegetation will result in the largest effect on
thermal energy to streams.
 Use NetMap to identify floodplains and terraces at multiple
elevations above the channel.
Use various NetMap tools to identify earthflows and their effects on valleys
and channels.
