TerrainViewer: Your Portal into the Big Picture
Users of TerrainWorks (NetMap) Watershed Assessments or NetMap tools can access the TerrainViewer with full functionality.
Examine spatial patterns of a large range of watershed attributes (fish habitats [anadromous, resident], erosion potential, floodplains, wildfire, climate change, grazing) at the scale of watersheds, landscapes, states and regions. Search for intersections (stressor - habitat overlaps) over large geographic areas
The map display or analysis extent is referred to as "scope"; the spatial scale of the analysis is referred to as "scale". Examples follow.
 A user can select a "scope" of a HUC 3 that encompasses all watersheds draining into Puget Sound in Washington State. Next, select a scale at which to view the selected attribute. Note that this must be smaller in scale that the scope, in this example: HUC 4, HUC 5 or HUC 6. Shown to the right is a 6th level HUC scale displaying coho salmon habitat potential.
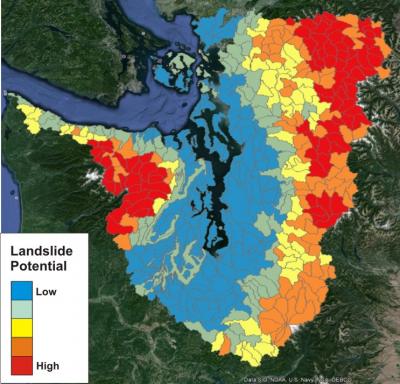 A user can also quickly select another attribute from the drop-down list to display for the same "scope", in this case, landslide potential.
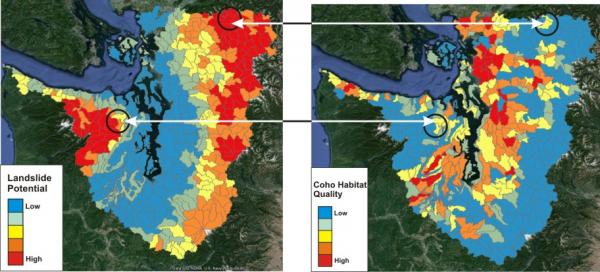
In addition to displaying various NetMap and other GIS data layers at various "scopes" and "scales", users can quickly search for overlaps of stressors with valuable habitats. In the example shown to the right, an analyst quickly searches for the specific 6th level HUCs where the top 10% of coho habitat potential (at the scale of the entire Puget Sound basin) overlaps with the top 5% of shallow landslide potential.
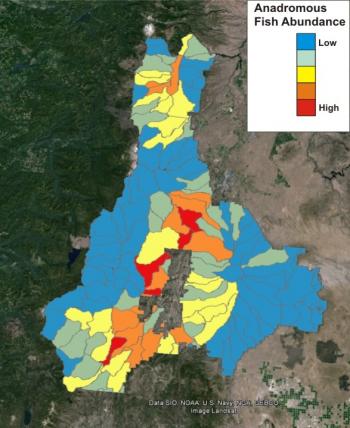 In addition to "scopes" of HUC levels (3, 4, 5), the TerrainViewer also uses "scopes" of certain agency jurisdictional boundaries, such as US Forest Service Regions, National Forests and Districts. For example, at the right is the entire Deschutes National Forest (eastern Oregon) displaying abundance of anadromous fish habitats at the scale of HUC 6.
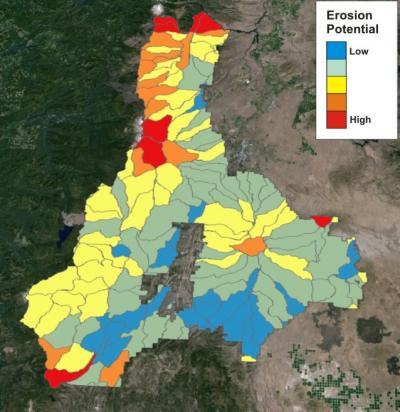 As in the Puget Sound example, an analyst can also select from other attributes in the drop down list, for example erosion potential.
 Or a user can select a "scope" of national forests and a "scale" of districts and the data will be summarized displayed accordingly.